

On this page
Redmine already has a good query builder — on the Issues page, the Spent time
page and the Projects page. What it has no way to do is keep one as a named
report you re-run on the first of the month, hand to somebody as a branded PDF,
or have arrive by email every Monday. Reports does that by reusing those three
builders rather than inventing a fourth: the filter row here is the filter row
from the Issues page, so a relative date like "this month" means the month you
press Run in.
On RedminePRO Cloud
Availability
Business and above.
Permissions
Administration → Roles and permissions, in the Reports section:
| Permission | What it grants |
|---|---|
Use reports |
Build, run, share and export reports |
It behaves as a workspace-wide capability: holding it in any role in any project means "this person builds reports", because a report spans whatever projects its filters reach and so does not belong to one.
What a report can show is never widened by it. Every row comes through the
visibility Redmine already applies to the reader — a report over issues shows
issues they may see, a report over logged time obeys their role's
Time logs visibility. Two people can open the same shared report and get
different row counts, and the page prints the count so the difference is visible
rather than mysterious.
Settings
Administration → Plugins → RedminePRO Reports:
| Setting | Default | Effect |
|---|---|---|
Default export format |
PDF |
Which format the Export control offers first |
PDF logo |
none | An image drawn at the top of every exported PDF |
Who may publish templates |
Administrators only |
Or Anyone who may use reports |
Scheduled delivery |
off | The master switch for emailed reports |
Scheduled delivery is off until you switch it on, so adding Reports to a
workspace never starts sending mail to anybody. PDF logo opens a page of its
own from Choose a logo.
Building a report
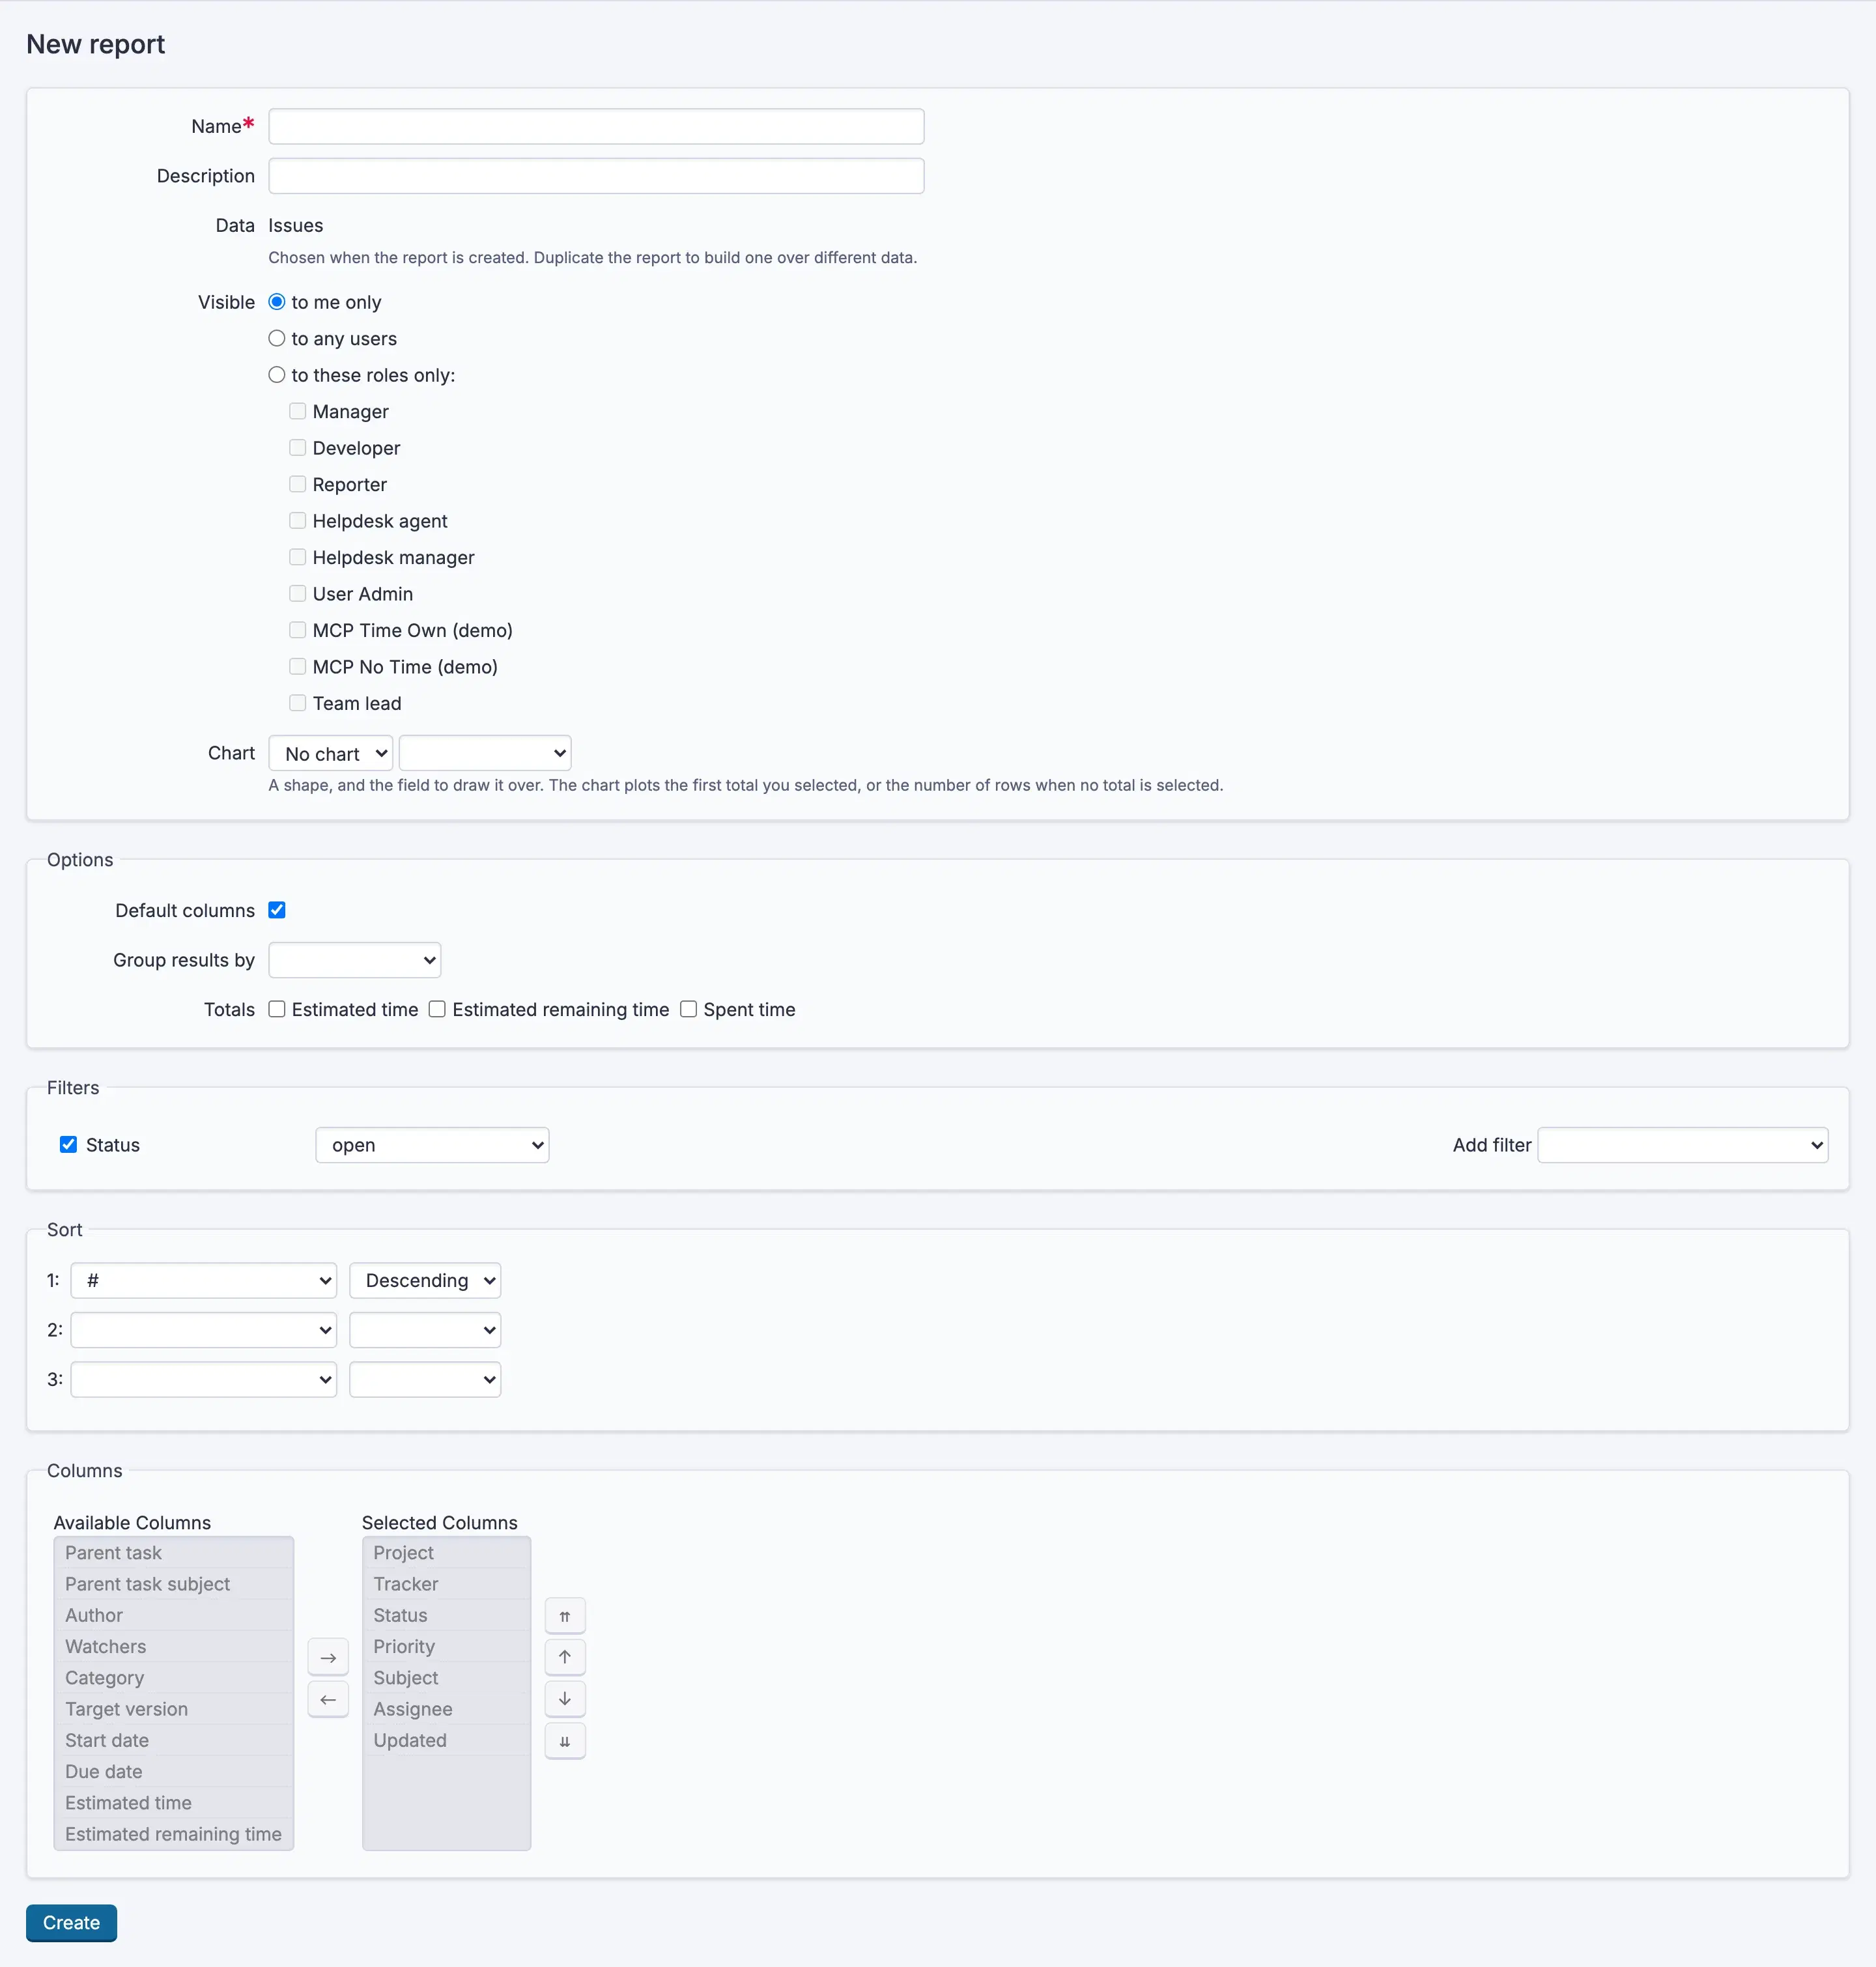
Reportsin the top menu →New report, then pick the data:Issues,Spent timeorProjects.- Build it with the controls you already know —
Add filter, the available and selectedColumnslists,Group results by, theTotalscheckboxes and the threeSortrows. - Give it a
Name, and optionally aChart—BarorPie— and the field to draw it over inChart over. - Choose who else sees it under
Visible:to me only,to these roles only, orto any userswho may use reports. Create.
The data source is chosen when the report is created and cannot be changed afterwards. Build a second report, or duplicate this one.
Running and exporting
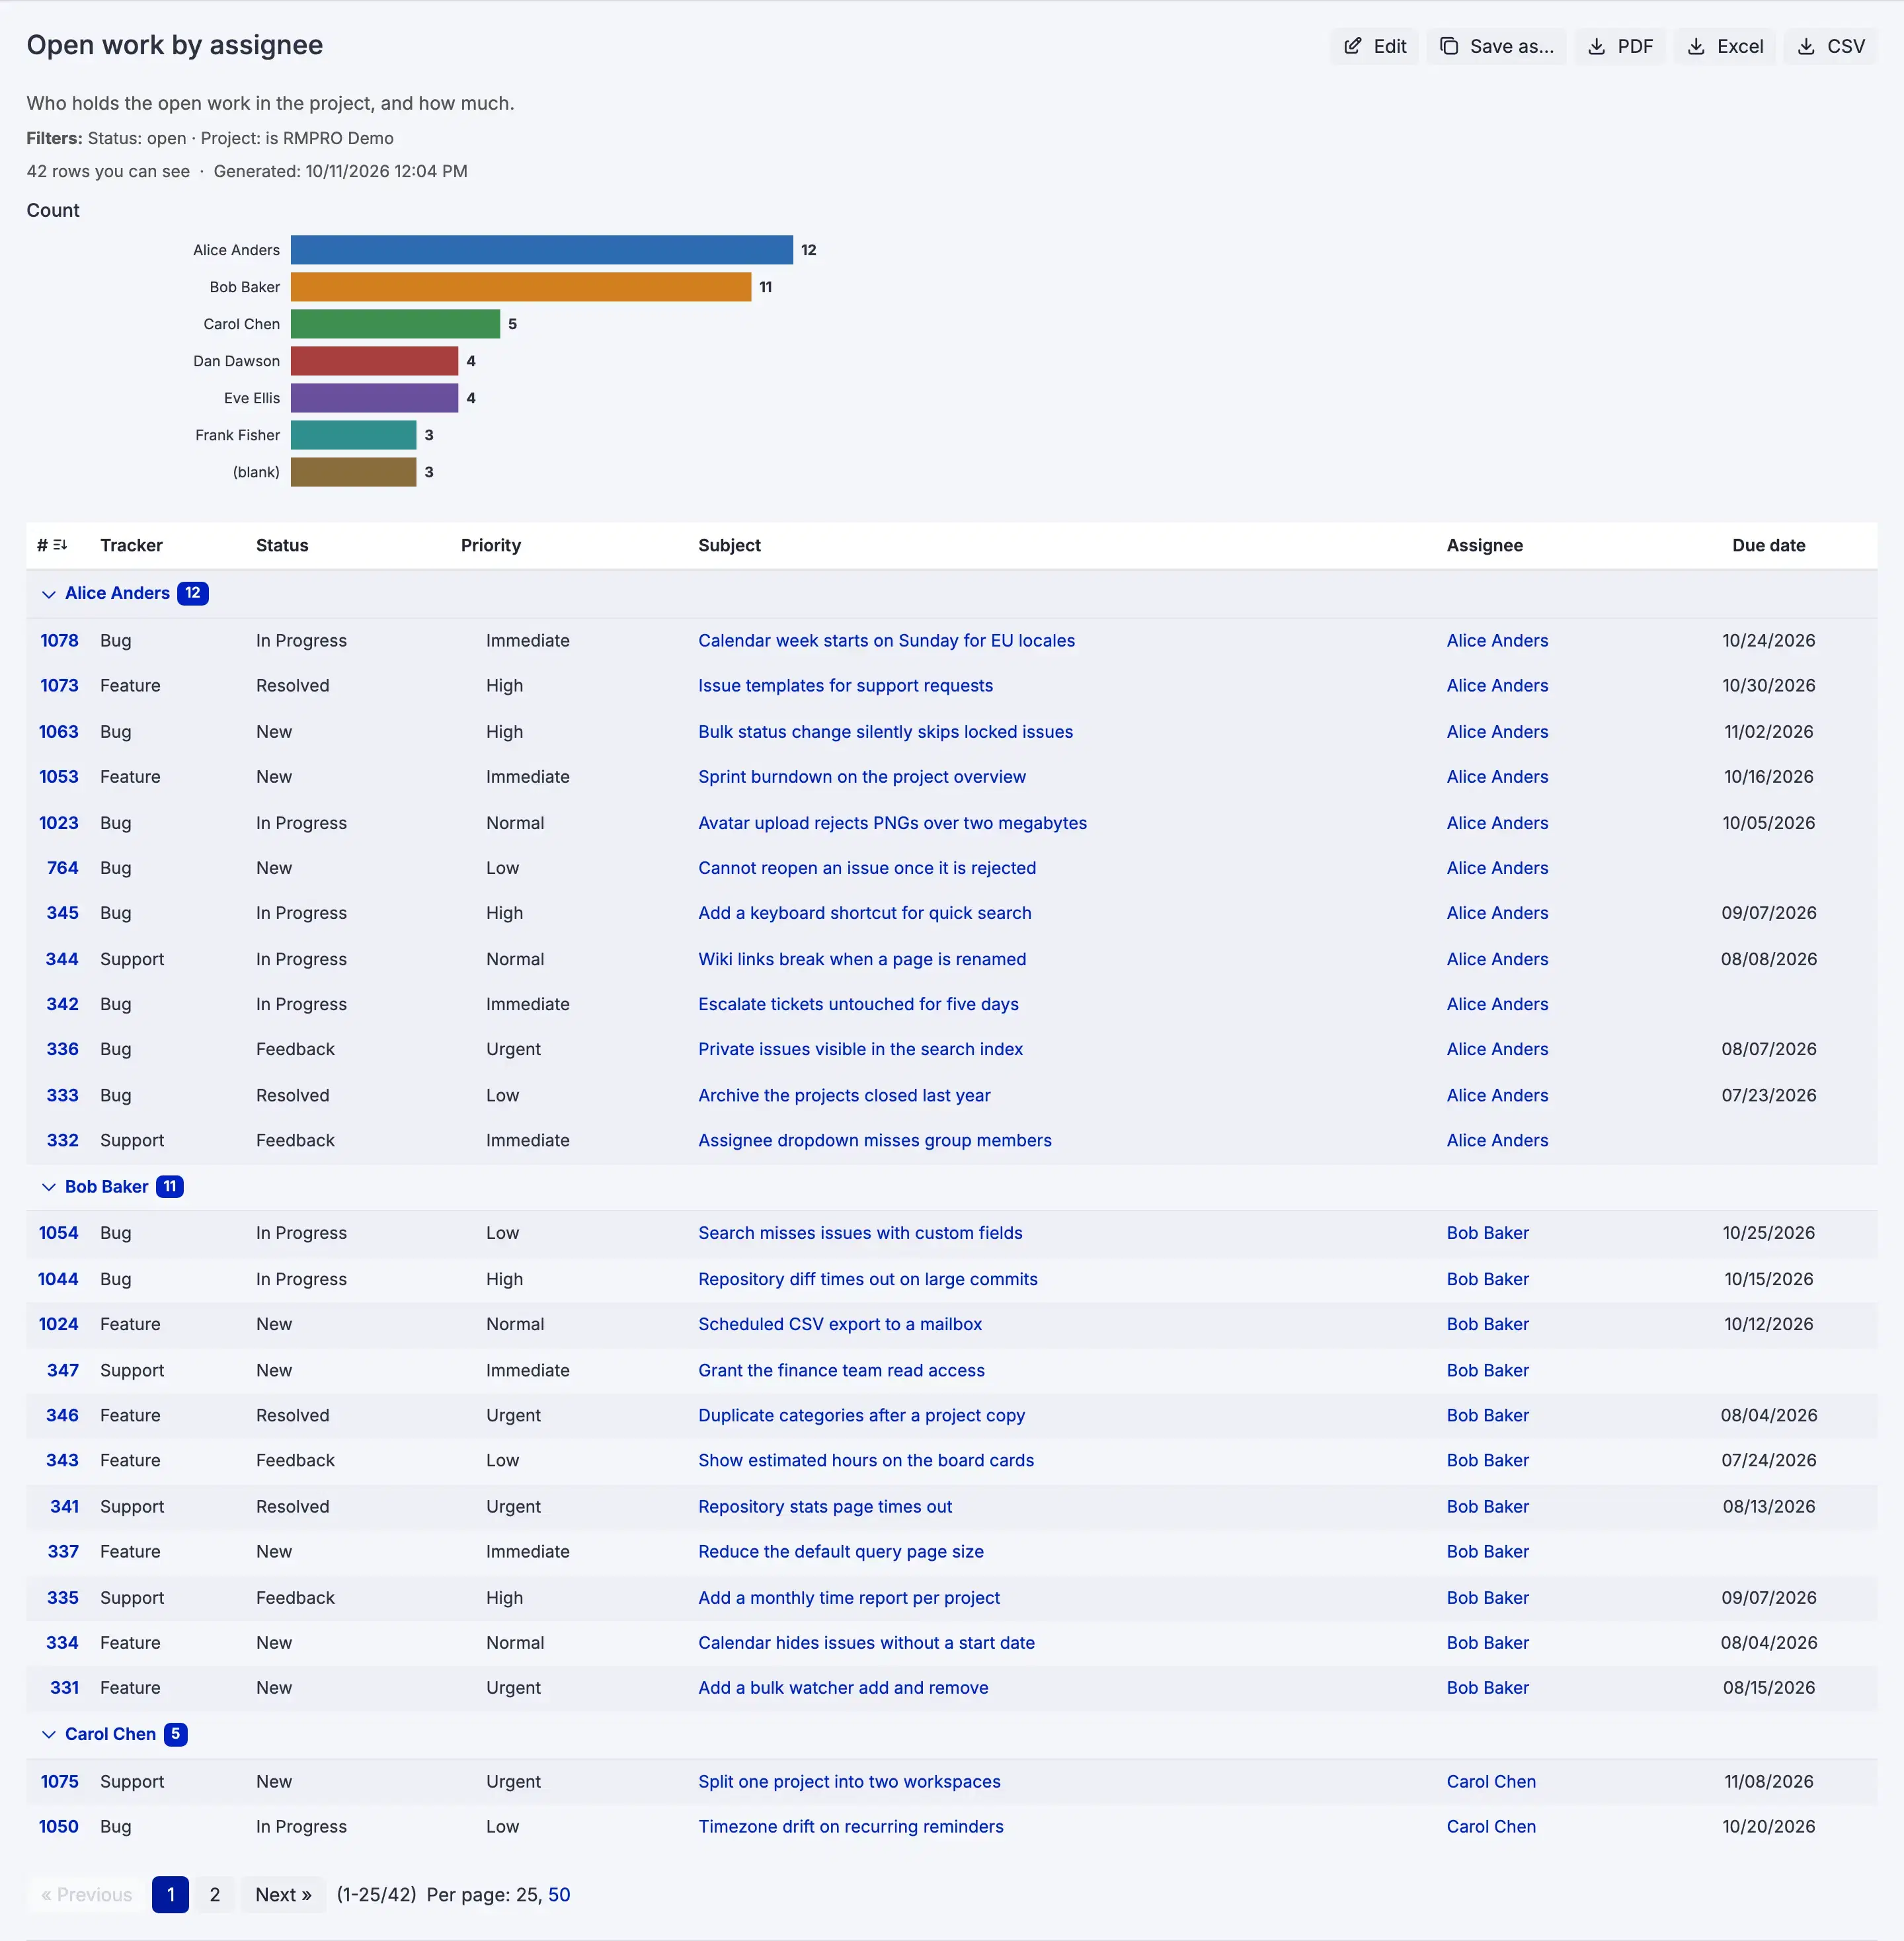
Opening a report evaluates its filters afresh. The page shows the filter summary
line, how many rows you can see, the chart, the grouped table with its subtotals
and totals, and an Export control.
| Format | What you get |
|---|---|
PDF |
Workspace name, report name, the filter summary, the chart, grouped tables with subtotals and totals, page numbers. Landscape once the table has seven columns or more. |
Excel |
A real spreadsheet: dates arrive as dates and numbers as numbers, so a column of hours can be summed. |
CSV |
Redmine's own CSV. |
Clicking a column heading re-sorts what you are looking at without changing the
saved report. Save as… takes a copy you own and can change freely. An export
carries at most 5000 rows.
Templates
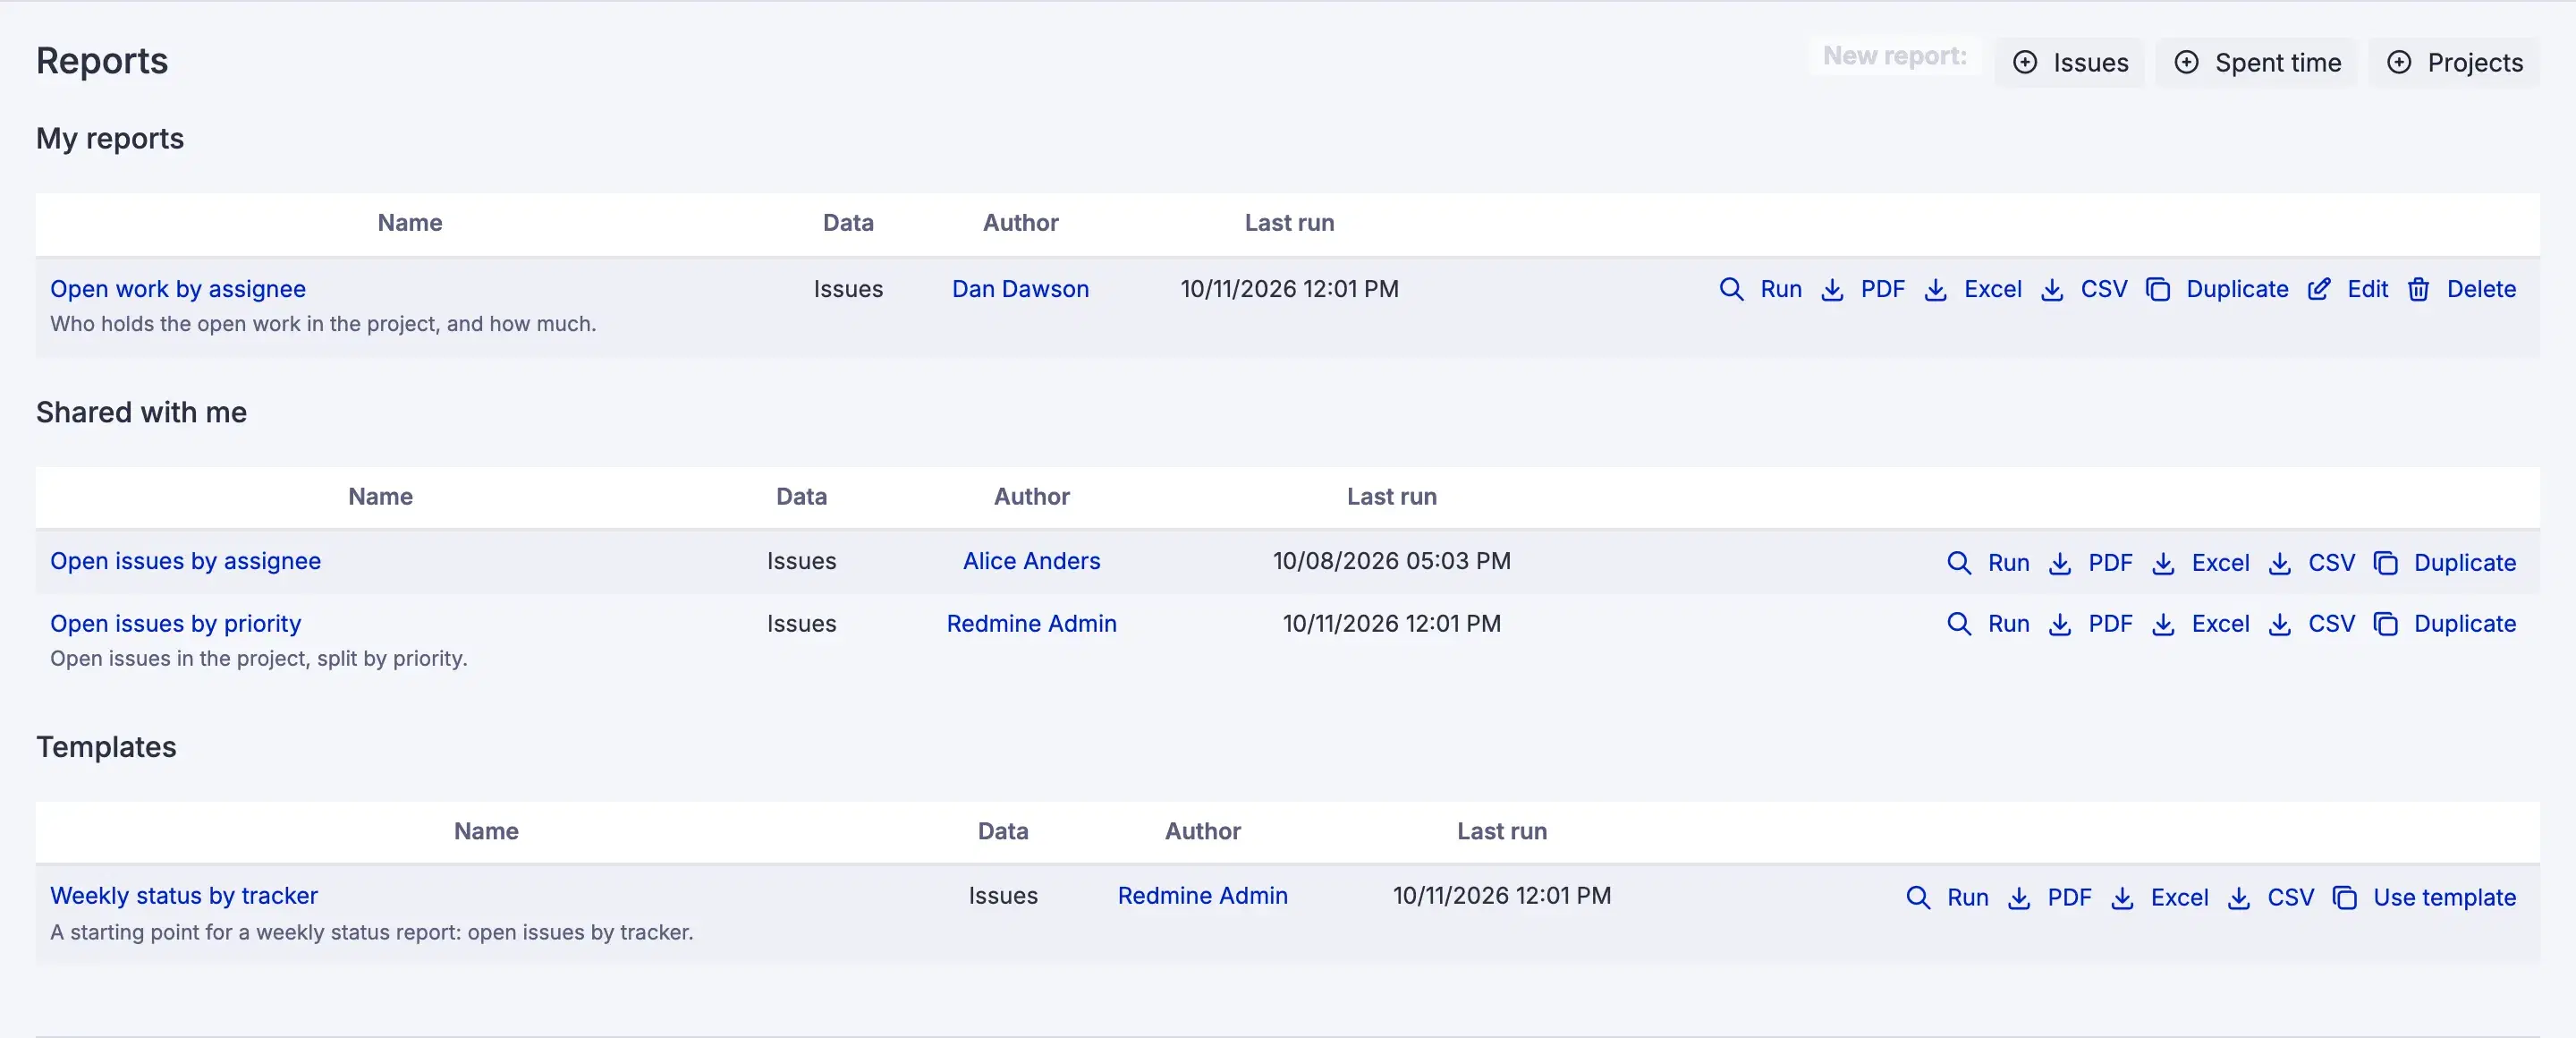
A report can be published as a Template. Templates get their own section of the
Reports page, and Use template gives somebody their own private copy —
independent from that moment, so the template's author can change or withdraw
theirs without touching it.
Who may publish templates is Administrators only by default, because
publishing puts a report in front of everyone. A report that is to me only
cannot be published: the Templates list shows each person only what they may
see, so it would appear to nobody but its author. Share it first.
Scheduled delivery
With Scheduled delivery switched on, a report can carry a schedule — Weekly
on a weekday or Monthly on a day of the month, at an hour — delivering the
PDF and the Excel file to people and groups you name. It is edited with the
report.
Three things to know before relying on it:
- The report is generated once, as its owner, so everybody receives the same figures.
- That is why the recipient list is filtered. Anybody who may not open the report is dropped and named on the report page. A schedule is not a way around visibility.
- A failure is shown, not swallowed. It appears on the report page rather than being retried silently every hour.
Times are the report owner's: Monday 08:00 means Monday 08:00 where they are. Monthly schedules stop at the 28th, because the 31st would skip February.
On My Dashboard
With My Dashboard 1.2.5 or newer in the workspace, a Saved report widget shows
the report you last ran — its totals, its first ten rows, and a link to run it in
full. On an older My Dashboard the widget does not appear.
Troubleshooting
No Reports in the top menu. The account holds Use reports in no role.
Reports opens on a page about plans. The workspace is below Business. The
page names the plan it needs rather than hiding the feature.
A colleague sees fewer rows than I do in the same report. That is correct. A report shows each reader what that reader may see; compare the two counts printed on the page.
An export says the report is too large. An export carries at most 5000 rows. Narrow the filters or the date range — and consider whether anybody reads a 5000-row attachment.
The chart is empty but the table is not. The chart needs a field to draw
over. Set Chart over in the report's editor.
Accented characters look wrong in a CSV opened in Excel. The Export
control asks for UTF-8, which Excel reads correctly. A CSV fetched by some other
means uses Redmine's own default for your language.
A scheduled report has not arrived. Check that Scheduled delivery is on,
that the cron line is installed, and the report page for a recorded failure or a
dropped recipient.
A recipient was dropped. They cannot open the report. Share it with them first — the schedule is not a way around visibility.