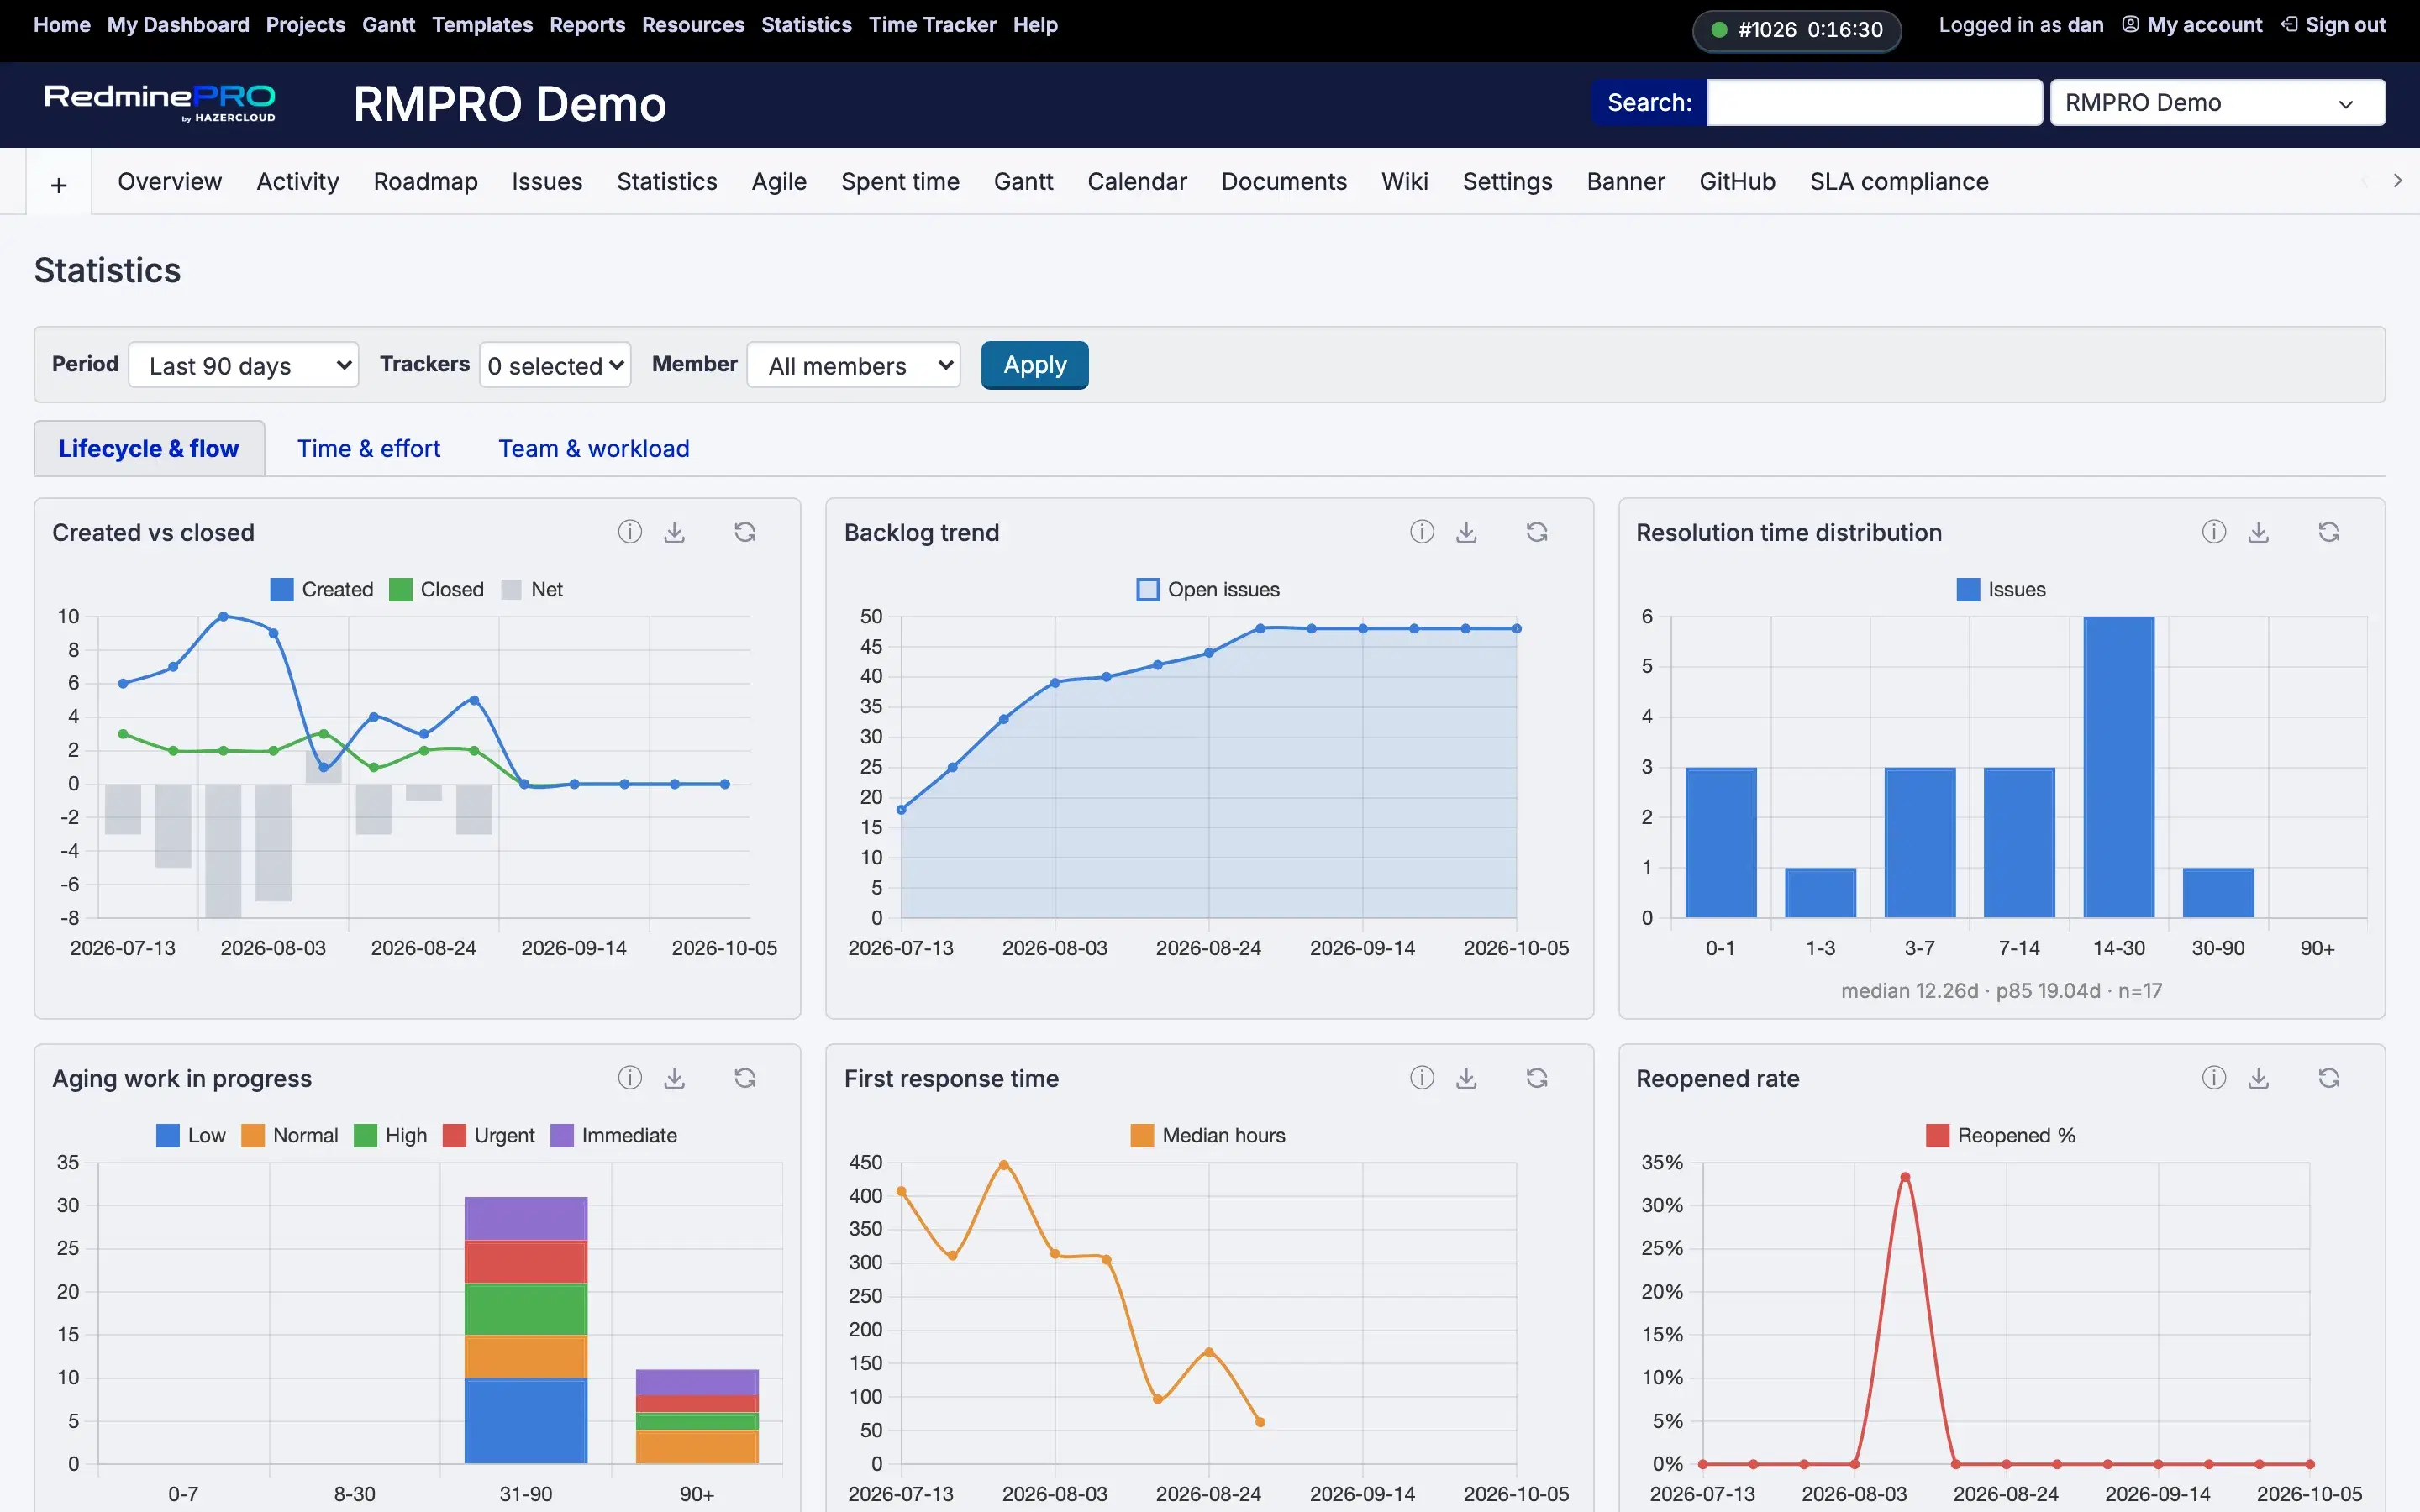

Lifecycle, effort, workload and health charts over your issues, per project or across all of them.
Documented for version 1.0.3 · Verified against 932d12e
Charts that answer the questions a list of issues cannot: are we closing as fast
as we open, where is effort actually going, who is carrying what, and which
projects are drifting. Four tabs — Lifecycle & flow, Time & effort,
Team & workload and Project health — over one project or across everything
you can see. Every figure explains how it was calculated, so a number can be
argued with rather than merely believed.